2015-03-19 14:41
scientists use seismic waves inside the earth with unprecedented precision drawing
|
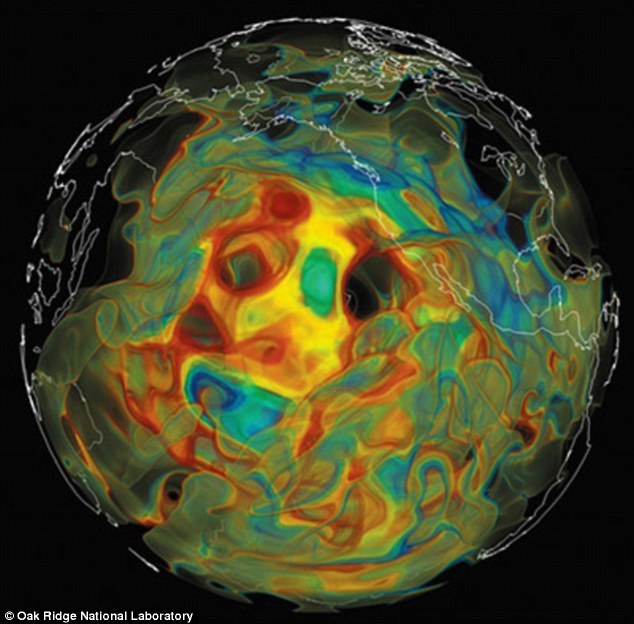
CNDSN3 month 19 days (Sina) American scientists simulated map by using seismic wave velocity plotted, revealing the underground structure. This picture simulation chart shows the Pacific mantle below, seismic waves are red and orange slow, fast seismic wave is green and blue.
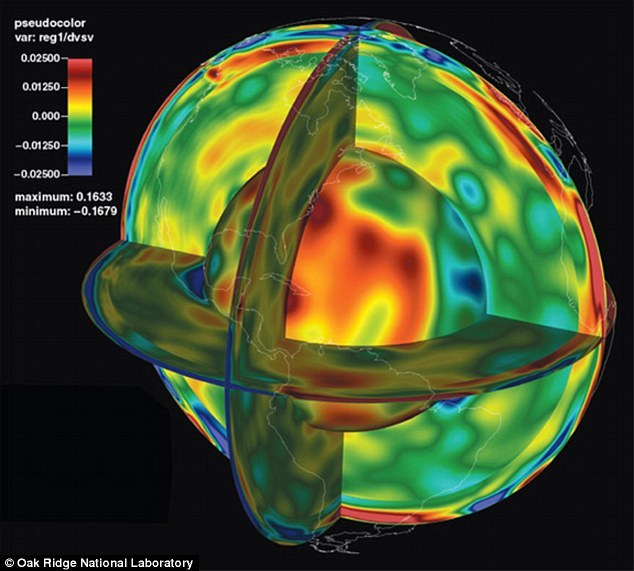
Show the interior of the earth 3D simulation diagram by Princeton University professor Jieluoen - troup led research team drawing. They were the objective of this study is to draw the whole mantle at the end of the map. Mantle reached a depth of 1865 miles (about 3000 km).
A contour 3D images, show the average value of seismic wave velocity over the area.
This image shows a depth of 241 miles (about 389 km) shear wave change. Seismic wave velocity exceeds the average value of the blue area, the seismic wave velocity in the Red areas below average.
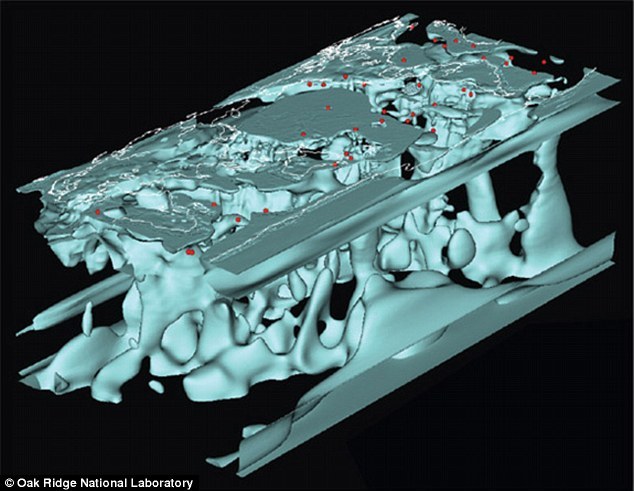
On the right side of the image from B to B, a depth of 746 miles (about 1200 km) of the European section map, corresponding to the left picture. A computer program troup and his research group research and development will be carried out seismic data and computer generated model of real comparison, and then using the difference comparison on the modified model. (original title: scientists use seismic waves inside the earth with unprecedented precision drawing:) Editor: Blue |